|
||||||||||||||||
|
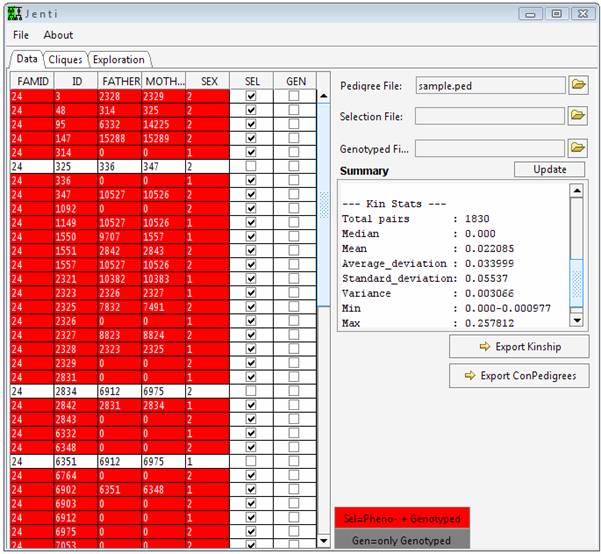
Before taking this tutorial Jenti should be installed in your system. Reading the documentation section is also essential. This tutorial will use the genealogy sample.ped, which isnt representative of the genealogy sizes that will be encountered in a real problem but can be helpful to briefly illustrate the program functionality. Additional examples will require the large genealogy large.ped. Start the program To start Jenti double click run.bat. Load the genealogical data sample.ped from the file menu or pressing the button in the main window. From the main window is it possible to change the individual attributes: the SEL flag indicates that the individual will be used in the clustering process, and GEN (for mapping purposes) indicates if the individuals have been genotyped. This latter attribute is taken into account only in the pedigree reconstruction step if the user requests to include in the pedigree genotyped parents and/or offspring to increase the inheritance information - for example for mapping purposes. Under this context, any selected (SEL) individual will be also considered as genotyped but his/her phenotypic data should be used only in a single sub-pedigree to avoid duplicated observations.
Identify a sample of
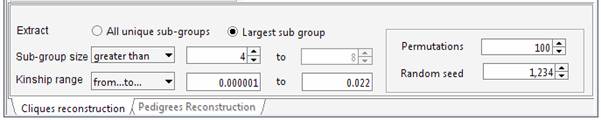
least unrelated individuals. Set the required parameters in the Cliques panel. For instance we can ask Jenti to identify the largest sample whose kinship is less than the average kinship as observed in the sample (0.022). We want to extract a sample including at least 4 individuals.
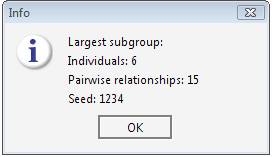
Run the search pressing
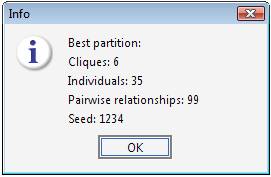
The best result has been found with seed 1234, which was the starting seed for the permutation procedure. Therefore the best cluster has been found in the first trial.
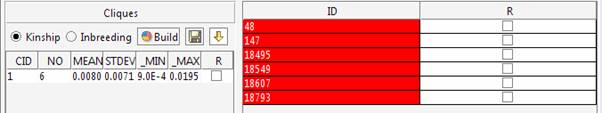
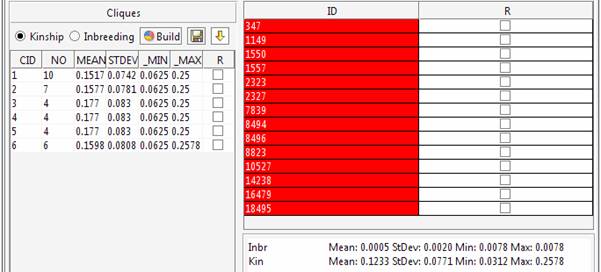
The kinship and inbreeding statistics are reported for each group.
The identified cluster can be saved in a text file Partitioning the
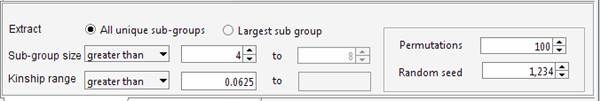
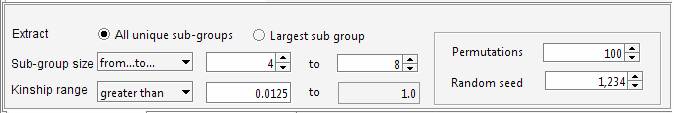
genealogy Set the required parameters in the Cliques panel. For instance we can ask Jenti to identify the best partition in sub-samples where the kinship among individuals is at least 0.0625 (as first cousins in an outbred population). We will ask the list of the largest sub-groups having not less than 4 individuals each.
Run the search pressing
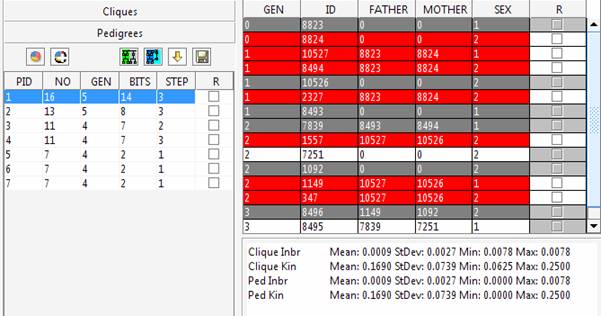
The 6 cliques can be explored in the main window.
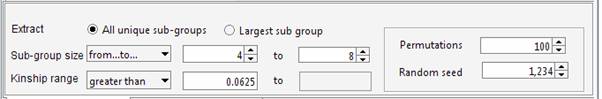
The aim of the program is maximizing the overall number of pair-wise relationships given the parameters (which are 99 in the current example) keeping at the same time the highest degree of relationship between the individuals belonging to the same cluster. If the aim of the analysis is extracting the largest number of individuals grouped in clusters of similar size, the user set an upper limit for the number of individuals that can be included in the same cluster. For instance to obtain clusters containing 4 to 8 individuals each:
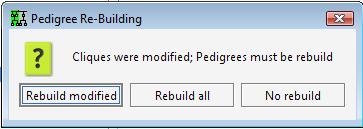
Using this setting the program extracts more individuals (38 instead of 35). Indeed in the previous analysis the largest sub-group comprised 10 individuals. The new settings discard sub-groups having size greater than 8, therefore 2 individuals are now available to generate new clusters with the remaining sample. This gives rise to a new group having size > 4. It should be noted that even if the number of individuals is increased, the overall number of pair-wise relationships is decreased (92 instead of 99). The decision on how the genealogy should be partitioned depends on the aim of the analyses. The tool allows exploring different configurations, and through the Residual Management functions is also possible to mix sub-groups of individuals selected wit different criteria. The identified cluster can be saved in a text file Building the pedigrees We will build the pedigrees connecting the individuals
belonging to each clique. Go to the Pedigrees sub-panel and press the
The left side of the panel shows the cliques list which can be individually visualized in the right side of the panel. In red are reported the individuals extracted in the clique, in white and grey the individuals used for their connection. The grey lines highlight individuals selected for the clustering procedure that can belong to a different sub-group. However, given the interconnections among the genealogy member they can appear in different sub-groups to allow the pedigree reconstruction. Any statistic evaluated with the generated pedigrees should consider complete information only for the selected (red) individuals. If the sub-pedigrees will be used for mapping purposes
the phenotypic values should be attributed only to the selected (red)
individuals in order to avoid bias in the statistics determined by the presence
of replicated samples. Under this context, the whole genotypic information can
often be used (including the replicated samples genotypes) to clarify the
inheritance pattern within the family. For this purpose when the pedigrees are
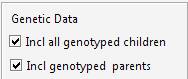
saved in a text file 0 no information have been provided for this individual 1 only the genotypic data can be used 2 both the genotypic and phenotypic data can be used 3,4 The genotypic data can be used. The individual has been initially choosed for the clustering procedure but wasn't included in any sub-group using the given parameters (-> residuals) - and was included in the family by the pedigree reconstruction step. The user can decide whether use also the phenotypic information in one of the sub-groups where he/she appears. To clarify the inheritance pattern within the family we can also include in each pedigree any offspring or parent with genotypic information. Include parents and offspring and rebuild the sub-pedigrees:
Each pedigree can be visualized in 2D and 2.5D.
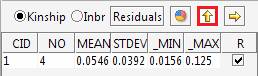
Using the Residuals Any individual that wasn't included in the sub-groups for the chosen parameters (or that have been deleted from a sub-groups) appears in the Residual list. We can cluster these individuals using another set of parameters and include the new group in the main list. Set the required parameters in the Residuals sub-panel. For instance identify new clusters where the kinship among individuals is at least 0.0125 (we used 0.0625 for the main selection).
A new group is identified, and can be selected and added to the main list:
or removed and put again in the residual list:
When a new group is added to the main list it appears in the Cliques panel. The Pedigrees panel identifies the new clique and proposes to build its sub-pedigrees:
Explore the different options using this simple genealogy before analysing a huge dataset! Additional examples a larger genealogy The genealogy large.ped connects a study sample of 642 individuals in a complex 2,292-person pedigree with multiple inbreeding loops. Load the genealogical data large.ped from the file menu or pressing the button in the main window. When genealogical data have been collected for a study sample some of the individuals (especially from the oldest generations) might be uninformative for genetic purposes if they dont appear in any line of descent connecting the subjects under study. Jenti allows identifying the sub-group of individuals providing useful information for genetic purposes. To remove the unnecessary individuals it is possible to either load a pedigree using the menu option load ConPedigree (automatically remove the uninformative subjects) or save a copy of the cleaned genealogical data after a pedigree has been loaded (and some changes have been eventually carried out) using the ExportConPedigree button.
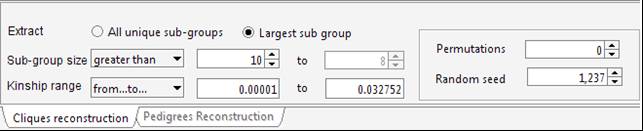
Select ExportConPedigree and save the new dataset (it will be saved in tab-delimited format). Open the new pedigree: the pedigree size is now 2,240 52 individuals from the original pedigree were actually uninformative for genetic purposes. Try to select a subset of less-related individuals for instance a group of individuals (>10) whose mutual kinship is up-to the median kinship observed for this sample, which is 0.032752. Set the parameters in the Cliques panel.
To avoid a long execution time the Random seed field can be set to 1,237 with 0 permutations (since this is the right setting for this dataset). Indeed, particularly when using large pedigrees, once a suitable solution has been identified for the given dataset and settings, the Random seed value can be stored to obtain the same solution in a next time and the permutations can be set to 0.
The selected 15 individuals can be connected in a single pedigree. Try connecting these individuals using the Include all common ancestors option. This option will preserve all the genealogical connections among individuals. The resulting sub-pedigree comprises 1451 individuals in 17 generations. Lets identify the best sub-sample where the kinship among individuals is at least 0.03125 (as first cousins once removed in an outbred population). We will ask the extracted sub-group having not less than 10 individuals each.
Again, to avoid a long execution time the Random seed field can be set to 1,243 with 0 permutations. In this case the execution time would be long, since using this genealogy the number of possible clusters of individuals separated by kinship >= 0.03125 is extremely large.
Try connecting these individuals using the Automatic pedigree reconstruction option. This option will try to preserve most of the genealogical connections among individuals while keeping the obtained sub-pedigree as small as possible. The pedigree size is 332 spreading 7 generations. Comparing the inbreeding and kinship observed using the whole dataset (Clique Inbr and Clique Kin) with the inbreeding and kinship observed in the extracted sub-pedigree (Ped Inbr and Ped Kin), we can note that some of the connections among individuals have not been included. Indeed, for instance, the mean kinship observed in the sub-pedigree is one third of what observed using the whole genealogy.
The pedigree structure can be interactively explored through PedVizApi (which for instance allows to highlight and follow the path between pairs).
Depending on the use of the extracted sub-pedigree (and
assumptions) we can also extract the sub-pedigree where all the connections
have been preserved (Include all common ancestors option), or increase the
number of Max meiotic steps (from the main panel or using the
pedigree-specific setting with the By including all the common ancestors the pedigree size increase to 1,942 in 17 generations, while using, for instance, 12 meiotic steps the pedigree size will be about one thousand and the mean kinship rises up to more than one half of what observed in the whole genealogy. |
||||||||||||||||
|
|
||||||||||||||||
|
|
||||||||||||||||