Demo Application
The Demo-Application highlights the features of PedVizApi by using a dynamic query interfaces (DQIs). A DQIs is a mechanism
for specifying queries and visualizing their results. The great advantage of DQIs is that they provide continuous feedback to the
user as the query is being formulated (Dynamic Querying).
Start Demo-Application: selecting one of the three modes:
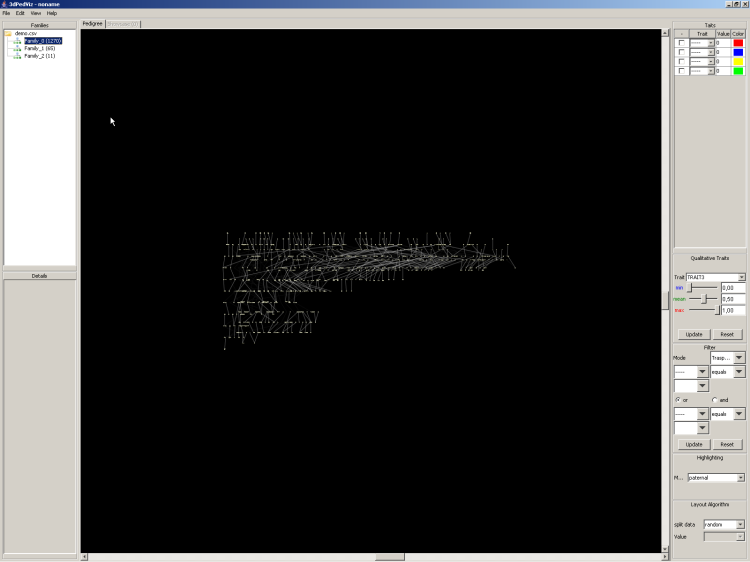
2.5d high quality: pedviz_demo.bat (on Windows Systems) or pedviz_demo.sh (on *NIX Systems)
2.5d low quality: pedviz_demo_low_quality.bat or pedviz_demo_low_quality.sh
2d: pedviz_demo_2d.bat or pedviz_demo_2d.sh
Attention: the performance for the 1270 individual family depends highly on the used graphic card and cpu.
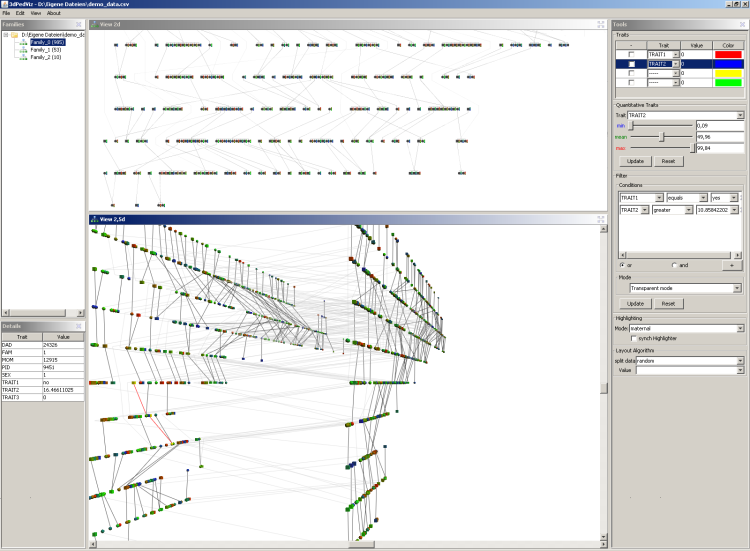
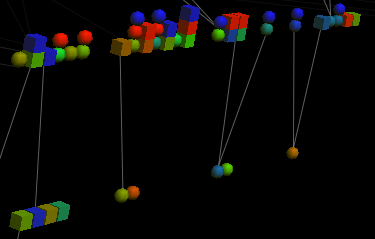
The following figure shows the screen after loading the demo_data.csv file. The software automatically extracts
pedigrees from the data-files (it ignores the family-id and therefore it can be used to split large pedigrees in connected ones):
in this case 3 pedigrees are identified.
The left upper tree shows the identified families and the corresponding number of individuals (founders, if missing,
are added automatically). Every single family can be saved with "Edit-> Save as csv".
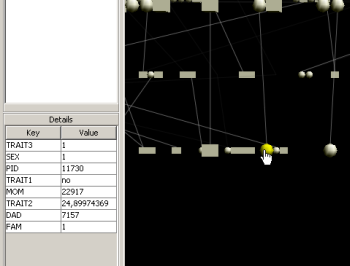
Details are shown in the left lower window by moving the mouse over a node.
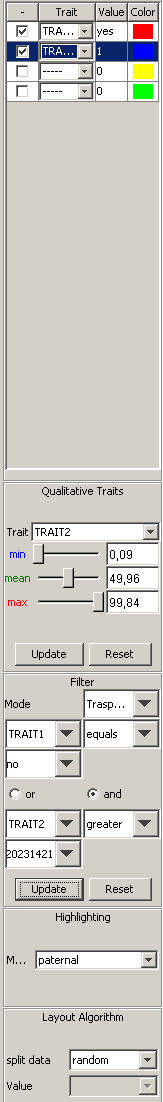
The dynamic querying interface (DQI) is located in the right panel. The demo data includes two qualitative traits (TRAIT1 and TRAIT3) and
one quantitative trait (TRAIT2)
In the upper DQI window the mapping of the qualitative traits can be made. It's possible to select different colours and to specifiy the
"affection true value". In the 2.5d visualization different traits are drawn by stacking coloured sex symbols; in 2d standard symbols are used.
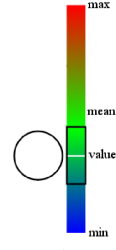
For qualitative traits min, max and mean value should be specified (otherwise default values will be proposed).
Depending on these values a virtual colour bar is created and an area around the individuals value is extracted and mapped on the pedigree.
With the help of the filter panel complex queries over all available fields can be definied. The results are displayed in real-time in two
different modes:
Transparent mode: only connections between individuals retrieved by the query are shown.
Blinking mode: individuals retrieved by the query are highlighted by blinking.
Selecting a node, connections between this individual and other individuals can be highlighted in different ways:
maternal lineage
paternal lineage
maternal and paternal lineage
all ancestors
all succestors
all ancestors and all succestors
Futhermore of the 2.5d visualization it's possible to select a method for distributing nodes on the 2 layers.
pedviz_demo_0.15.zip: Extends the basic Demo Application by a linked 2d and 2.5d advanced user interface.
 The dynamic querying interface (DQI) is located in the right panel. The demo data includes two qualitative traits (TRAIT1 and TRAIT3) and
one quantitative trait (TRAIT2)
The dynamic querying interface (DQI) is located in the right panel. The demo data includes two qualitative traits (TRAIT1 and TRAIT3) and
one quantitative trait (TRAIT2)
 Depending on these values a virtual colour bar is created and an area around the individuals value is extracted and mapped on the pedigree.